Snapshots
Polymarket identifiers, questions, rules, prices, and time-stamped snapshots flow into the database on every cycle.
An independent forecasting system for identifying where political prediction markets diverge from model fair value.
PPI runs on a twice-daily schedule: it captures market snapshots, collects structured evidence, builds independent probability estimates, and publishes the spread between model and market. The index is live.
The partisan premium is the market-implied probability minus PPI's independent fair value. Positive means the market prices the outcome higher than the model does.
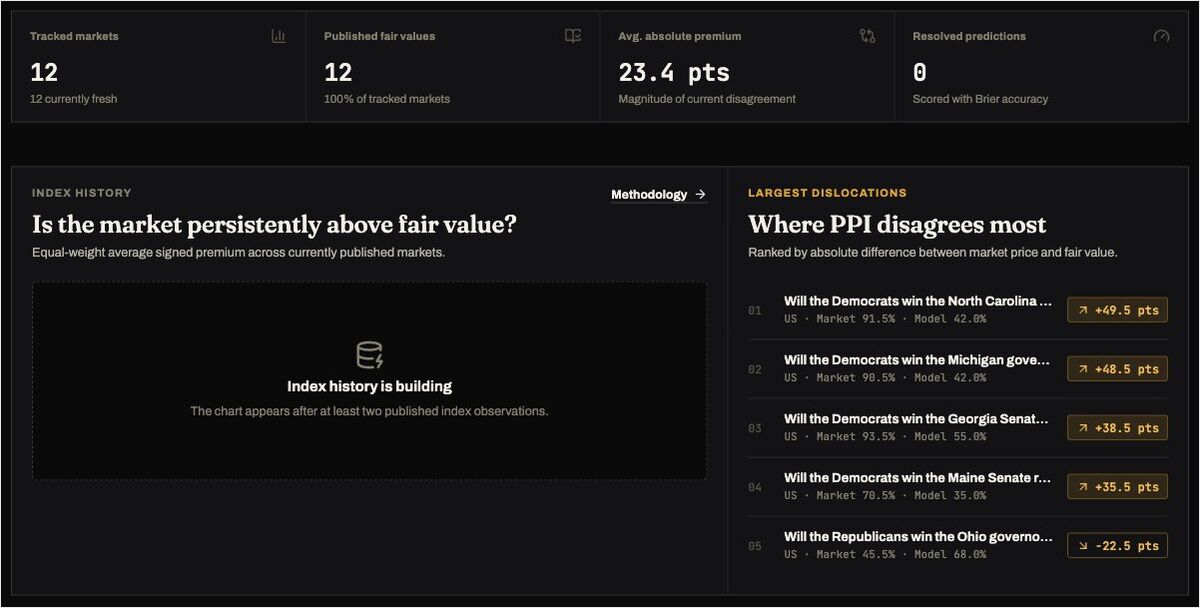
The five widest gaps between market price and model fair value, from the live terminal. Across all twelve tracked markets the average absolute premium is 23.4 points, and the market sits above model fair value in ten of twelve.
| Market | Market | Model | Premium |
|---|---|---|---|
| Democrats win the NC Senate race · RSO-0042 | 91.5% | 42% | +49.5 |
| Democrats win the MI governor race · RSO-0052 | 90.5% | 42% | +48.5 |
| Democrats win the GA Senate race · RSO-0044 | 93.5% | 55% | +38.5 |
| Democrats win the ME Senate race · RSO-0026 | 70.5% | 35% | +35.5 |
| Republicans win the OH governor race · RSO-0061 | 45.5% | 68% | −22.5 |
Premium in percentage points. All five markets resolve at the 2026 U.S. midterms and are unresolved as of this snapshot.
Will the Democrats win the North Carolina Senate race in 2026? — the widest dislocation in the current index. Every PPI value has this much provenance behind it.
deepseek-v4-flash · run ppi-daily:2026-08-26:primaryNo tracked markets have resolved yet. This section will populate automatically as tracked markets reach resolution — from the live terminal's own record ↗ opens in a new tab, not from anything on this page.
Illustrative evaluation preview — synthetic examples, not PPI results.
| Market | Model | Market | Outcome | Model error | Market error |
|---|---|---|---|---|---|
| Example race A | 62% | 55% | 1 | 38 pp | 45 pp |
| Example race B | 31% | 44% | 0 | 31 pp | 44 pp |
| Example race C | 78% | 71% | 1 | 22 pp | 29 pp |
| Example race D | 40% | 58% | 1 | 60 pp | 42 pp |
Outcome is 1 if the event happened, 0 if it did not. These four rows live only in demo/evaluation-fixtures.json, flagged synthetic: true — they are not in any PPI dataset, database, or run.
(forecast probability − outcome)², averaged over resolved markets — lower is better.
|forecast probability − outcome| per market, in percentage points.
The model's error against the contemporaneous prediction-market probability captured at the same time — which was closer, and by how much.
Group forecasts into probability bands and compare the predicted frequency with the realized frequency, once the sample is large enough to mean anything.
Every market snapshot, evidence item, and fair-value estimate is stored prospectively rather than overwritten, so these run against a genuine forecast-of-record the moment a market resolves — no back-fitting.
Polymarket identifiers, questions, rules, prices, and time-stamped snapshots flow into the database on every cycle.
Every forecast preserves the evidence and source-run provenance behind it — a record of what the model knew at prediction time.
Every estimate is versioned alongside the evidence and inputs that produced it.
PPI captures market and evidence snapshots on a twice-daily schedule; the published index updates as new runs complete.
Each estimate is an independent probability built from LLM-assisted analysis of polling, fundamentals, and primary-source evidence, versioned with the inputs that produced it.