The Canadian Shawarma Report
Somewhere in this country there is a better shawarma than the one you were about to order.
673 locations and 782,946 Google reviews across six Canadian markets, scored with one transparent methodology — not star averages, not vibes. Published as a standalone site with per-market ranked tables.
Top of the London table.
London is the report's home market: 59 locations resolved, 57 ranked, 54,936 reviews read. The ranking is the artifact — this is the current top five, by report score.
- 01Mr. Shawarma & Chicken8.20
- 02Wow Shawarma8.14
- 03Saj & Tanoor8.12
- 04Fadi’s Shawarma8.11
- 05Shawarma House8.05
Scores are on a 0–10 scale from the review-scoring model below, not the Google star average. Full London table and five other markets on shawarmareport.ca ↗ opens in a new tab.
Change the question, the podium changes.
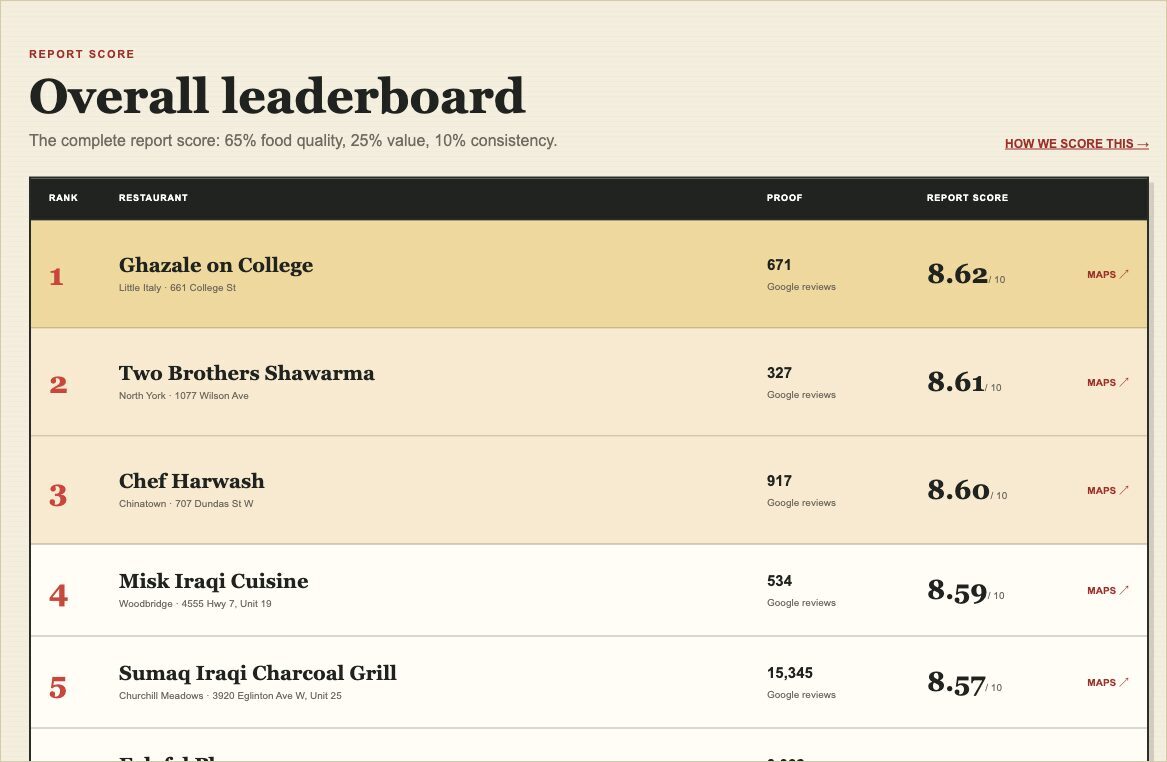
Six markets.
| Market | Resolved | Ranked | Reviews read |
|---|---|---|---|
| Greater Toronto Area | 319 | 306 | 409,349 |
| Calgary | 78 | 68 | 111,771 |
| Ottawa–Gatineau | 104 | 102 | 91,236 |
| Montréal | 69 | 48 | 60,438 |
| Waterloo Region | 44 | 43 | 55,216 |
| London | 59 | 57 | 54,936 |
| Total | 673 | 624 | 782,946 |
Review total is the sum of each location's downloaded review count across the six per-market datasets. Montréal coverage is scoped to the City of Montréal proper.
The scoring model.
A pipeline resolves each candidate location, pulls its Google reviews, and runs them through one scoring model: a Bayesian rating with recency weighting, a per-location review cap, a text component derived from review language, and a volume score. Each location gets a 0–10 score, a market rank, and a Toumometer rating.
- Rating
A Bayesian score on a 0–10 scale with a prior, so a handful of five-star reviews does not outrank a well-established restaurant with thousands of reviews.
- Recency
Newer reviews carry more weight; a single review is capped so it cannot swing a location on its own.
- Text
Most of the score comes from review language — what people actually say about the food — rather than the star average.
- Volume
A separate volume score rewards locations with enough reviews to be confident about.
- Ranking
Locations are ranked within their market; those below the confidence threshold are listed as provisional or unscored, not ranked.
Source.
- The published report, all six marketsshawarmareport.ca ↗ opens in a new tab
- Scoring model, data pipeline, and per-market datasetsGitHub ↗ opens in a new tab